How Much Should A SaaS Startup Invest In Sales & Marketing?
By Tomasz Tunguz from Redpoint Ventures
How much should a SaaS startup invest in sales and marketing at different stages of the business? This is a very nuanced question, but benchmarks do provide some guidance for what is reasonable. Sales and marketing investment depends on many different factors including establishing product market fit, the business’s sales model (inside, field, freemium), and not least, cash balance and fundraising capacity.
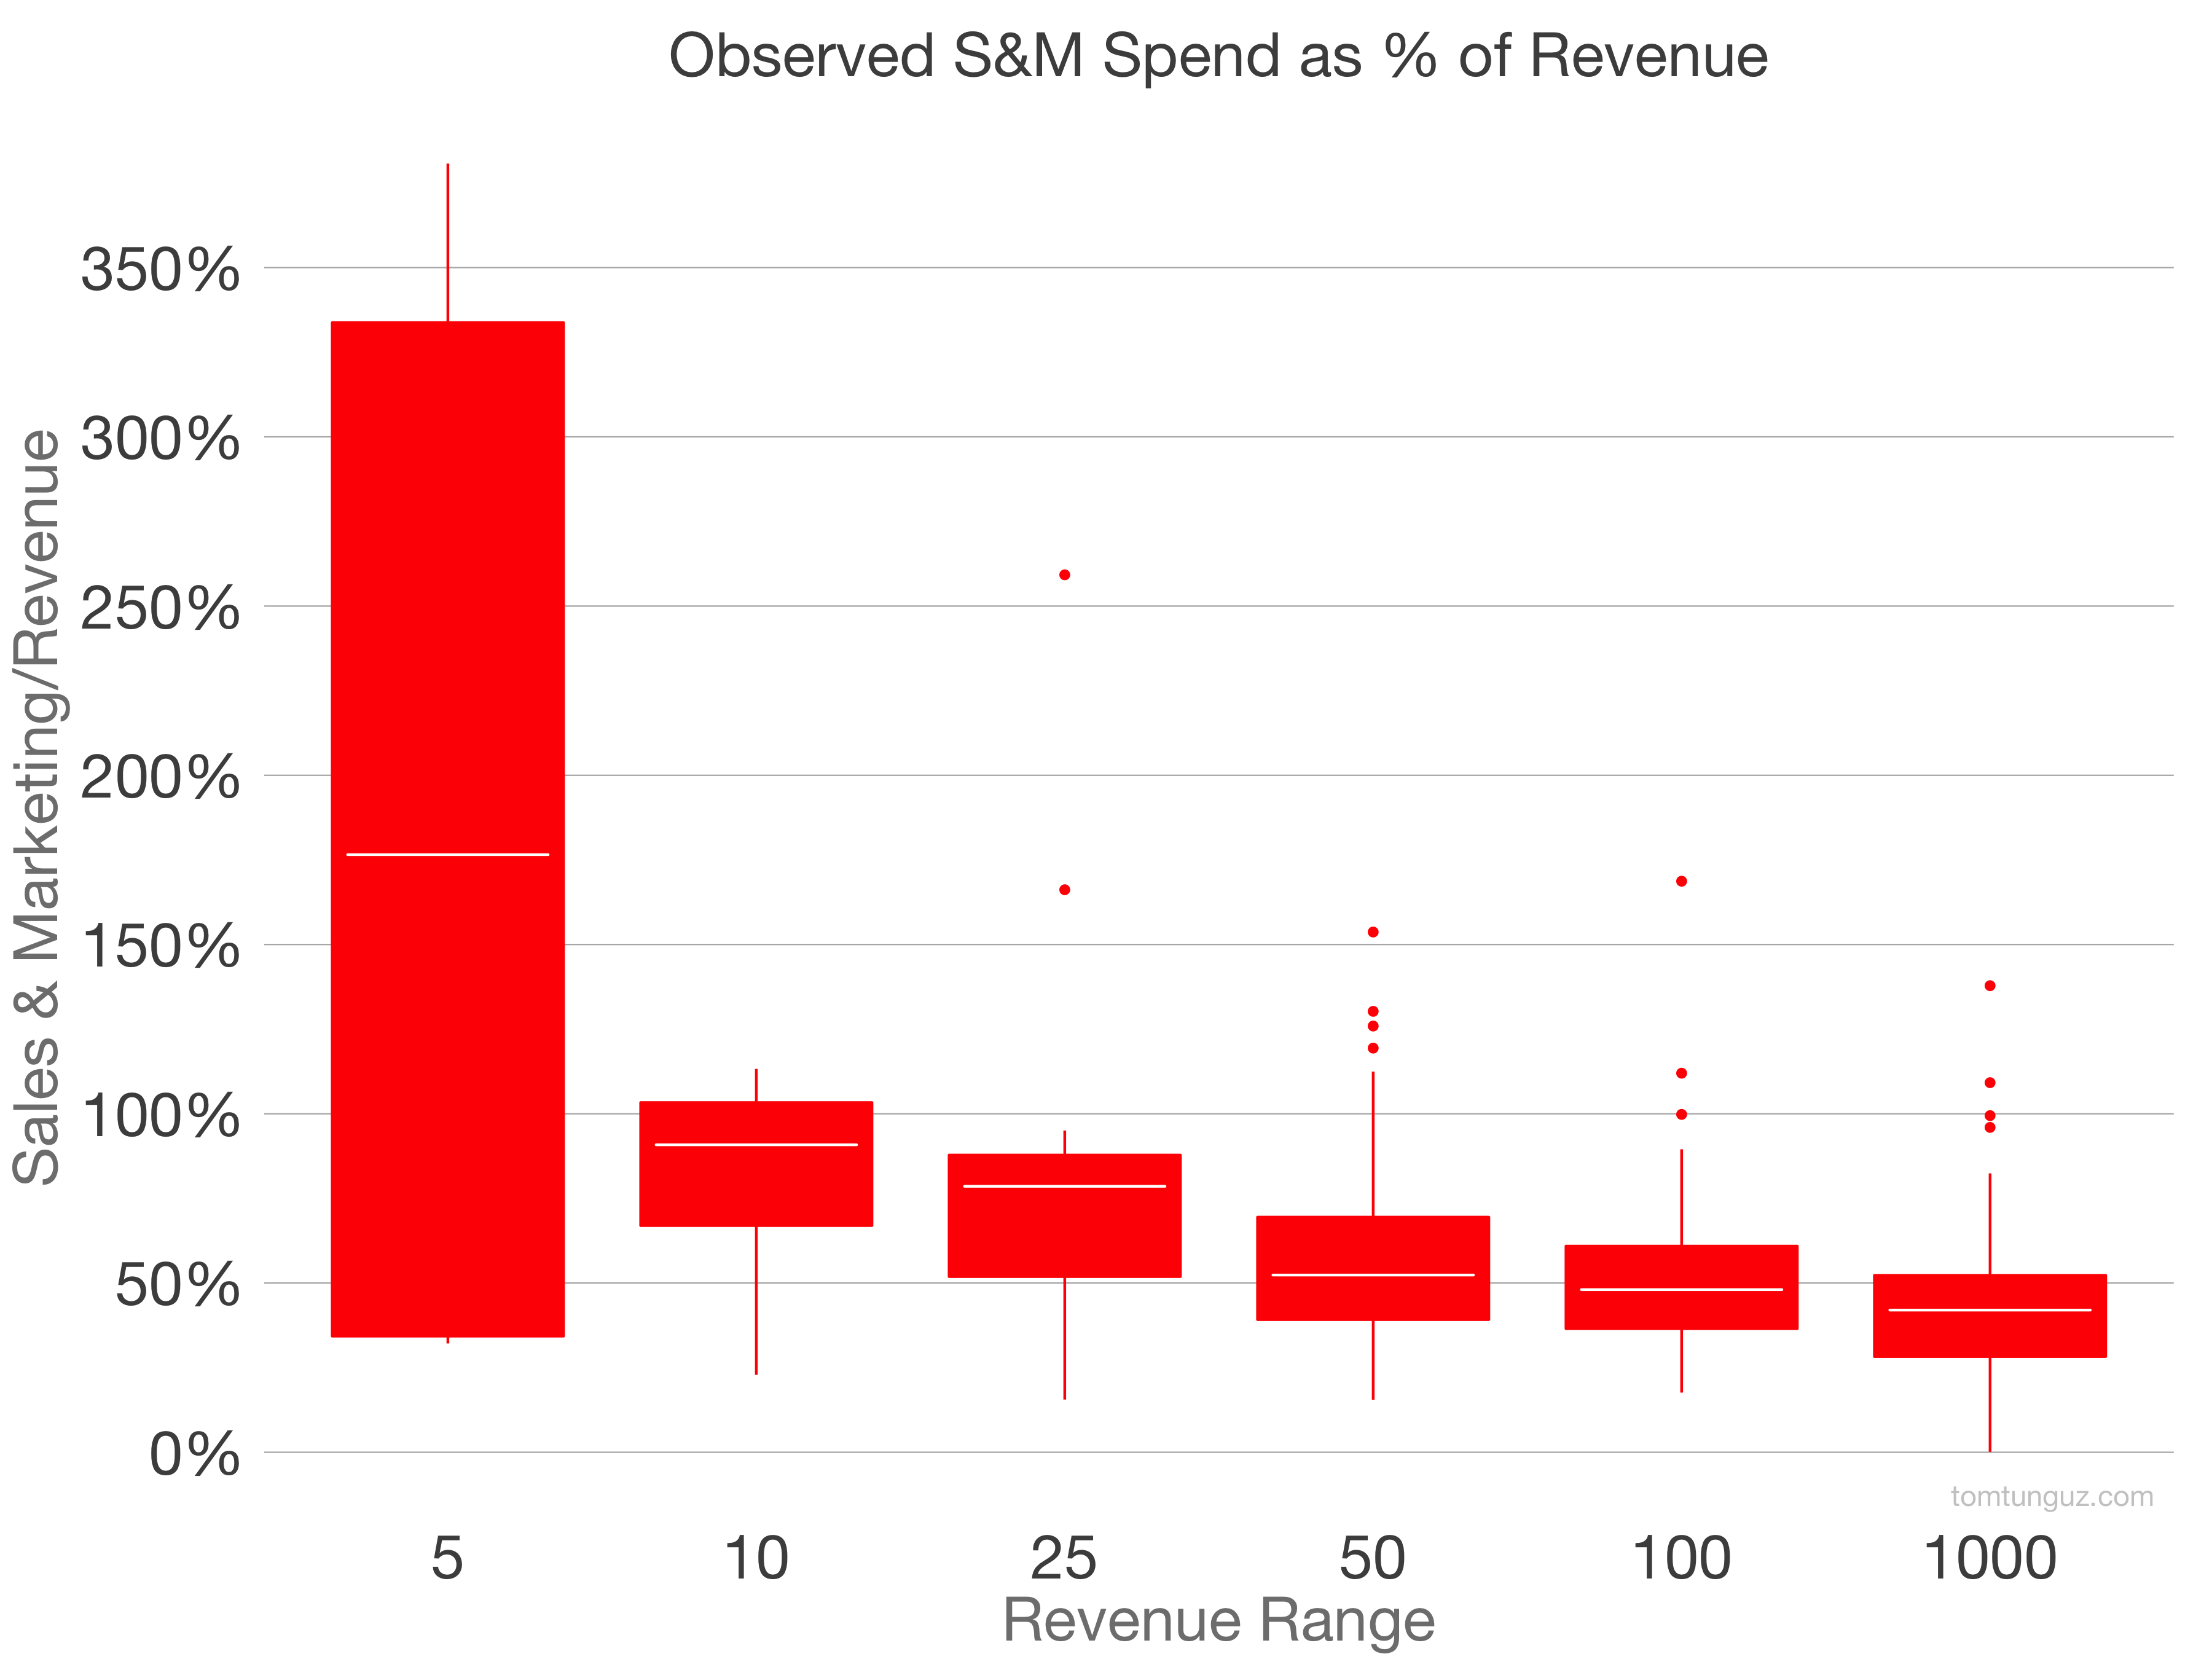
The chart above shows the sales and marketing investment of publicly traded software companies at different revenue levels. It is a box plot, which means the top and bottom of the box represent the 25th and 75th percentiles. The line in the middle is the median, and the dots outside the box are outliers.
The box marked revenue range 10 indicates the median publicly traded company at between $5M and $10M of revenue spent about 90% of revenue on sales and marketing.
Looking in the outer revenue ranges at $25M, $50M and $100M, that figure asymptotes to about 50%. However there are some notable outliers to continue to spend close to 150% or 250% of revenue even at the $100M mark.
Another way to answer this question is to use at Pacific Crest’s SaaS survey to build a bottoms up model. You can find mine here. Notably, I assume an 18 month payback period. I also assume that sales represents 65% of customer acquisition cost, which is true for inside sales models according to the survey. Separately, I assume a stratospheric growth rate for this business. Bookings triple, triple, double, double, and double over the first five years.
This growth rate is not representative of most SaaS companies, but I wanted to see whether the bottoms of model would yield a much more aggressive sales and marketing spend plan than that observed in the public markets. Last, I estimated revenue from bookings, a calculatoin detailed in the Revenue Estimate tab of my spreadsheet.
The table below summarizes the conclusions from the worksheet.
| Year | 1 | 2 | 3 | 4 | 5 |
|---|---|---|---|---|---|
| Bookings, $M | 1 | 3 | 12 | 24 | 48 |
| Revenue, $M | 0.4 | 1.5 | 6.4 | 17 | 40 |
| Sales Spend % of Revenue | 250% | 165% | 154% | 107% | 85% |
| Marketing Spend % of Revenue | 134% | 89% | 83% | 57% | 46% |
| S&M % of Revenue | 384% | 253% | 237% | 164% | 130% |
For our explosively fast-growing SaaS company, we invest 384% of revenue in sales and marketing in the first year. This figure declines to 253% in year two and then falls to 130% in year five.
Comparing it to the public charts above, this bottoms up analysis of a top 5% SaaS company suggest that the business will invest substantially more in sales and marketing than the median company. However it is consistent with some of the outliers.
If you would like to estimate the amount of sales and marketing investment your SaaS company might make, and test different conditions, download the simple worksheet here and play around with assumptions by changing the cells in red. It’s not a fully fledged model, but a very basic scenario forecasting tool.
This worksheet, in combination with the benchmarks provided above, should help you bracket your sales and marketing spend as you grow your SaaS startup.

